ShapesDoPlot Class Reference
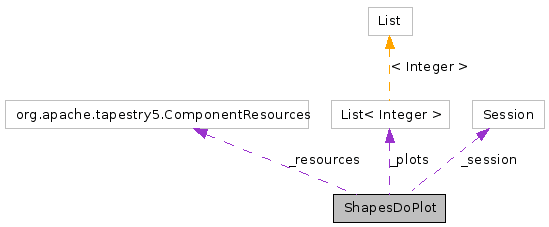
Collaboration diagram for ShapesDoPlot:

Public Member Functions | |
| void | setPlots (List plots) |
| void | setExpnames (Map expnames) |
| void | setIrns (Map irns) |
| void | setDsids (Map dsids) |
| void | setYaids (Map yaids) |
| void | setCkbxs (Map ckbxs) |
| void | setEcms (Map ecms) |
| void | setVars (Map vars) |
| void | setYlinlog (String ylinlog) |
| Link | getChart1 () |
| XYIntervalSeries | getDataSeries (int n, YAxis yaxis) |
| StreamResponse | onChart (final int width, final int height, final int numberRun, int number) |
Detailed Description
Definition at line 51 of file ShapesDoPlot.java.
Member Function Documentation
| void setPlots | ( | List | plots | ) |
| void setExpnames | ( | Map | expnames | ) |
| void setIrns | ( | Map | irns | ) |
| void setDsids | ( | Map | dsids | ) |
| void setYaids | ( | Map | yaids | ) |
| void setCkbxs | ( | Map | ckbxs | ) |
| void setEcms | ( | Map | ecms | ) |
| void setVars | ( | Map | vars | ) |
| void setYlinlog | ( | String | ylinlog | ) |
| Link getChart1 | ( | ) |
Definition at line 109 of file ShapesDoPlot.java.
References ShapesDoPlot.getDataSeries().
00109                            {
00110         if (numberRun > 10000) {
00111             numberRun=0;
00112         }
00113         numberRun += _nplots+1;
00114         int _nn = -1;
00115         for (int n = 0; n<=_nplots; n++){
00116            if( _ckbxs.get(n) ){
00117              _nn += 1;
00118              XYIntervalSeries series = getDataSeries(n,getYAxis(n));
00119              seriesMap.put(numberRun+_nn,series);
00120            }
00121         }
00122         return _resources.createActionLink("chart", false, new Object[]{"400","400",numberRun,_nn+1});
00123     }
| XYIntervalSeries getDataSeries | ( | int | n, | |
| YAxis | yaxis | |||
| ) |
Definition at line 125 of file ShapesDoPlot.java.
Referenced by ShapesDoPlot.getChart1().
00125                                                              {
00126         XAxis _xaxis =  yaxis.getDataset().getXAxis(1);
00127         for (String comment : yaxis.getDataset().getComments()){
00128             titlestring = comment;
00129         }
00130 //        XYIntervalSeries series = new  XYIntervalSeries(yaxis.getDataset().getPaper().getSpiresId());
00131         XYIntervalSeries series = new  XYIntervalSeries(
00132         _expnames.get(n)
00133         .concat("/")
00134         .concat(_irns.get(n).toString())
00135         .concat("/")
00136         .concat(_dsids.get(n).toString())
00137         .concat("/")
00138         .concat(_yaids.get(n).toString())
00139         .concat("/")
00140         .concat(_ecms.get(n))
00141         );
00142         for (int ip=1; ip<=yaxis.getPoints().size(); ip++){
00143             double y = yaxis.getPoint(ip).getValue();
00144             double eplus = 0.0;
00145             double eminus = 0.0;
00146             for (Uncertainty e : yaxis.getPoint(ip).getErrors()){
00147                eplus = eplus + e.getPlus()*e.getPlus();
00148                eminus = eminus - e.getMinus()*e.getMinus();
00149             }
00150             eplus = Math.sqrt(eplus);
00151             eminus = Math.sqrt(eminus);
00152             double yhigh = y + eplus;
00153             double ylow = y - eplus;
00154             double x;
00155             double xhigh;
00156             double xlow;
00157             if(_xaxis.getBin(ip).getLowValue() != null  && _xaxis.getBin(ip).getHighValue() != null){
00158                 x = (_xaxis.getBin(ip).getLowValue()+_xaxis.getBin(ip).getHighValue())/2;
00159                 xlow =  _xaxis.getBin(ip).getLowValue();
00160                 xhigh =  _xaxis.getBin(ip).getHighValue();
00161             }
00162             else{
00163                 x = _xaxis.getBin(ip).getFocus();
00164                 xhigh = _xaxis.getBin(ip).getFocus();
00165                 xlow = _xaxis.getBin(ip).getFocus();
00166             }
00167             series.add(x,xlow,xhigh,y,ylow,yhigh);
00168         }
00169             return series;
00170     }
| StreamResponse onChart | ( | final int | width, | |
| final int | height, | |||
| final int | numberRun, | |||
| int | number | |||
| ) |
Definition at line 171 of file ShapesDoPlot.java.
00171                                                                                                      {
00172
00173         final XYIntervalSeriesCollection collection = new XYIntervalSeriesCollection();
00174         for (int n=0; n<number; n++){
00175             XYIntervalSeries series = (XYIntervalSeries) seriesMap.get(numberRun+n);
00176             seriesMap.remove(numberRun+n);
00177             collection.addSeries(series);
00178         }
00179         IntervalXYDataset data1 = collection;
00180
00181         final XYItemRenderer renderer1 = new XYErrorRenderer();
00182         final Range rangex = new Range(0.0,1.0);
00183         System.out.println(rangex.toString());
00184         final NumberAxis rangeAxisX = new NumberAxis(getYAxis(0).getDataset().getXAxis(1).getHeader());
00185         rangeAxisX.setRange(rangex);
00186 //        rangeAxisX.setAutoRangeIncludesZero(false);
00187         NumberAxis rangeAxisY = null;
00188         String _label = getYAxis(0).getHeader();
00189         System.out.println("log lin is " + _ylinlog);
00190         if(_ylinlog.equals("YLIN")) {
00191            rangeAxisY = new NumberAxis(_label);
00192         }
00193         else{
00194             rangeAxisY = new LogarithmicAxis(_label);
00195             ((LogarithmicAxis)rangeAxisY).setAllowNegativesFlag(true);
00196             ((LogarithmicAxis)rangeAxisY).setAutoRangeNextLogFlag(true);
00197         }
00198         final XYPlot subplot1 = new XYPlot(data1, rangeAxisX, rangeAxisY, renderer1);
00199         final TextTitle title = new TextTitle(titlestring);
00200         final JFreeChart chart = new JFreeChart(subplot1);
00201         chart.addSubtitle(title);
00202         return new StreamResponse(){
00203             public String getContentType(){
00204                 return "image/png";
00205             }
00206             public InputStream getStream() throws IOException {
00207                 BufferedImage image  = chart.createBufferedImage(width, height);
00208                 ByteArrayOutputStream byteArray = new ByteArrayOutputStream() ;
00209                 ChartUtilities.writeBufferedImageAsPNG(byteArray, image) ;
00210                 return new ByteArrayInputStream(byteArray.toByteArray());
00211             }
00212             public void prepareResponse(Response response){}
00213         };
00214     }
The documentation for this class was generated from the following file:
- /home/buckley/hepdata/codedocs/src/hepdata/hepdata-webapp/src/main/java/cedar/hepdata/webapp/pages/ShapesDoPlot.java
 1.5.5
1.5.5